optimize data access in SQL Server (PART 2)
Step 8: Diagnose performance problems, and use SQL Profiler and the Performance Monitoring Tool effectively
The SQL Profiler tool is perhaps the most well-known performance troubleshooting tool in the SQL Server arena. In most cases, when a performance problem is reported, this is the first tool that you are going to launch to investigate the problem.
As you perhaps already know, the SQL Profiler is a graphical tool for tracing and monitoring a SQL Server instance, mostly used for profiling and measuring the performance of the TSQLs that are executed on the database server. You can capture each event on the server instance and save event data to a file or table to analyze later. For example, if the production database performs slowly, you can use SQL Profiler to see which Stored Procedures are taking too much time to execute.
Basic use of the SQL Profiler tool
There is a 90% chance that you already know how to use it. But I assume a lot of newbies out there who are reading this article might feel good if there is a section on the basic usage of the SQL Profiler (if you know this tool already, just feel free to skip this section). So, here is a brief section:
Start working with the SQL Profiler in the following way:
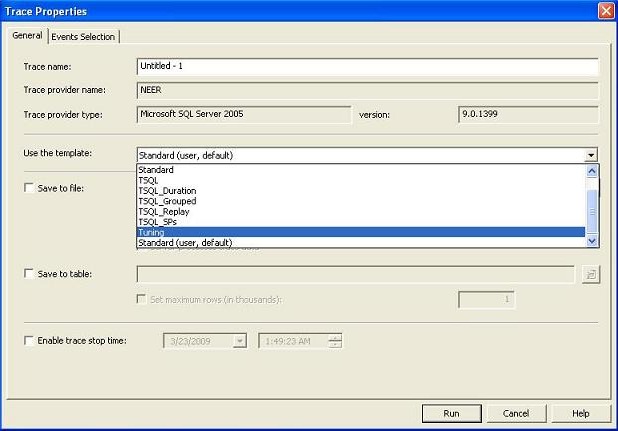
- Launch SQL Profiler (Tools -> SQL Server Profiler in Management Studio) and connect it to the desired SQL Server instance. Select a new trace to be created (File -> New Trace) and select a trace template (a trace template is a template where some pre-selected events and columns are selected to be traced).
- Optionally, select particular events (which should be captured in the trace output) and select/deselect columns (to specify the information you want to see in the trace output).
- Optionally, organize the columns (click the "Organize Columns" button) to specify the order of their appearance in the trace. Also, specify the column filter values to filter the event data which you are interested in. For example, click on "Column Filters" and specify the database name value (in the "Like" text box) to trace events only for the specified database. Please note that filtering is important because SQL Profiler would otherwise capture unnecessary events and trace too many information that you might find difficult to deal with.
- Run the profiler (by clicking the green Play button) and wait for the events to be captured on the trace.
- When enough information is traced, stop the profiler (b pressing the red Stop icon) and save the trace either into a trace file or into a SQL Server table (you have to specify a table name and the SQL Server Profiler would create the table with necessary fields and store all the tracing records inside it).
- If the trace is saved on a table, issue a query to retrieve the expensive TSQLs using a query like the following:
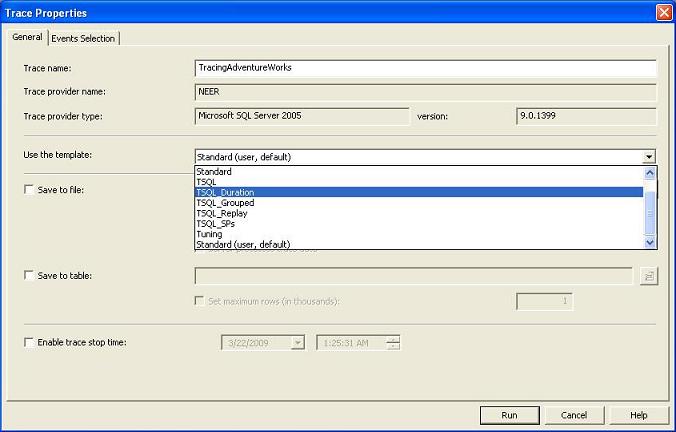
Trace template
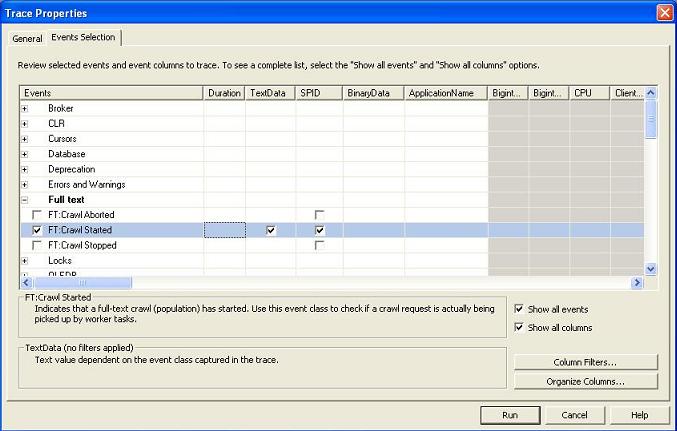
Select events to be captured for tracing
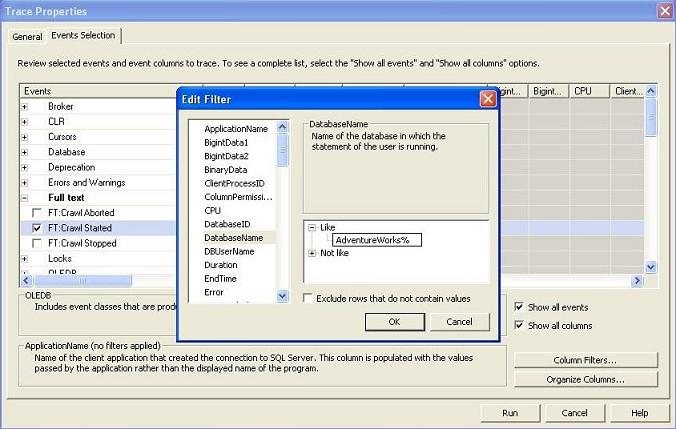
Filter column values

Running the profiler
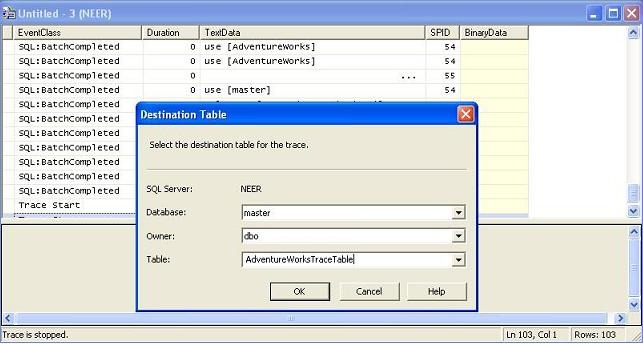
Storing profiler trace data into a table
SELECT TextData,Duration,..., FROM Table_Name ORDER BY
Duration DESC
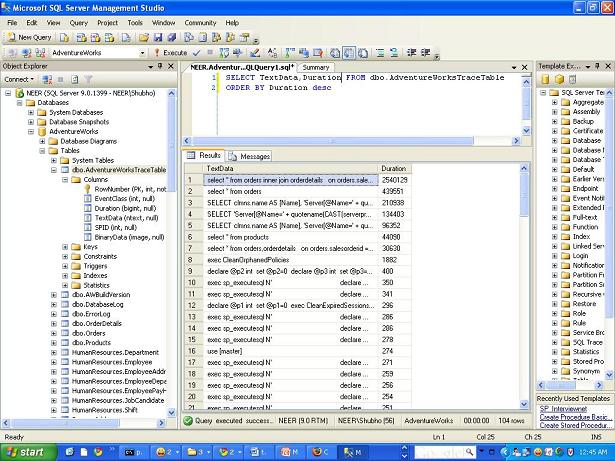
Querying for the most expensive TSQL/Stored Procedure
Voila! You just identified the most expensive TSQLs in your application in quick time.
Effective use of SQL Profiler to troubleshot performance related problems
In most cases, SQL profiler is used to trace the most expensive TSQLs/Stored Procedures in the target database to find the culprit that is responsible for performance problems (described above). But, the tool is not limited to just providing TSQL duration information. You can use many of the powerful features of this tool to diagnose and troubleshoot different kinds of problems that could occur due to many possible reasons.
When you are running SQL Profiler, there are two possibilities. Either you have a reported performance related issue that you need to diagnose, or you need to diagnose any possible performance issue in advance so that you can make sure your system would perform blazing fast in production after deployment.
Following are some tips that you can follow while using the SQL Profiler tool:
- Use existing templates, but create your own templates when in need. Most of the time, existing templates will serve your purpose. But still, there could be situations when you will need a customized template for diagnosing a specific kind of problem in the database server (say, deadlock occurring in the production server). In this situation, you can create a customized template using File -> Templates -> New Template, and specifying the template name and events and columns. Also, you can select an existing template and modify it according to your needs.
- Capture TableScan or DeadLock events. Did you know that you can listen to these two interesting events using SQL Profiler?
- Create Replay trace. As you already know, in order to troubleshoot any performance problems in the production database server, you need to try to simulate the same environment (set of queries, number of connections in a given time period that are executed in the production database) in your test database server first so that the performance problem can be re-generated (without re-generating the problem, you can't fix it, right?). How can you do this?
- Create Tuning trace. The database tuning advisor is a great tool that can give you good tuning suggestions to enhance your database performance. But, to get a good and realistic suggestion from the tuning advisor, you need to provide the tool with the "appropriate load" that is similar to the production environment. That is, you need to execute the same set of TSQLs and open the same number of concurrent connections in the test server and then run the tuning advisor there. SQL Profiler lets you capture the appropriate set of events and columns (for creating the load in the tuning advisor tool) by using the Tuning template. Run the profiler using the Tuning template, capture the traces, and save it. Then, use the tuning trace file for creating the load in the test server by using the Tuning advisor tool.
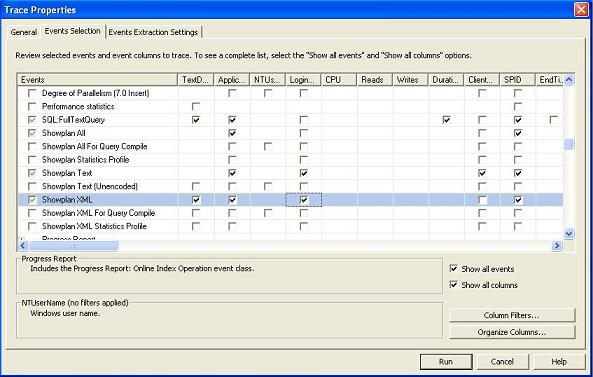
- Capture ShowPlan to include SQL execution plans in the profiler. There will be times when the same query will give you different performance in the production and test servers. Suppose you have been reported with this kind of a problem, and to investigate the performance problem, you need to take a look at the TSQL execution plan that is being used in the production server for executing the actual query.

Creating a new template
Specifying events and columns for the new template
Imagine a situation where you have done all possible indexing in your test database, and after testing, you have implemented the indexes in the production server. Now, suppose that for some unknown reasons, you are not getting the desired performance in the production database. You suspect that some undesired table scanning is taking place while executing one of the queries. You need to detect the table scan and get rid of it, but how could you investigate this?
Another situation. Suppose you have a deployed system where error mails are being configured to be sent to a pre-configured email address (so that the development team can be notified instantly and with enough information to diagnose the problem). All of a sudden, you start getting error mails stating that deadlocks are occurring in the database (with the exception message from the database containing database level error codes). You need to investigate and find the situation and the corresponding set of TSQLs that are responsible for creating the deadlock in the production database. How would you carry this out?
SQL Profiler gives you several ways to investigate these. You can edit the templates so that the profiler listens for any table scan or deadlock event that might take place in the database. To do this, check the Deadlock Graph, Deadlock, and DeadLock Chain events in the DeadLock section while creating/editing the tracing template. Then, start the profiler and run your application. Sooner or later, when any table scan or deadlock occurs in the database, the corresponding events would be captured in the profiler trace, and you would be able to find out the corresponding TSQLs that are responsible for the above described situation. Isn't that nice?
Note: You might also require the SQL Server log file to write deadlock events so that you can get important context information from the log when a deadlock takes place. This is important because sometimes you need to combine the SQL Server deadlock trace information with that of the SQL Server log file to detect the involved database objects and TSQLs that are causing deadlocks.

Detecting table scan
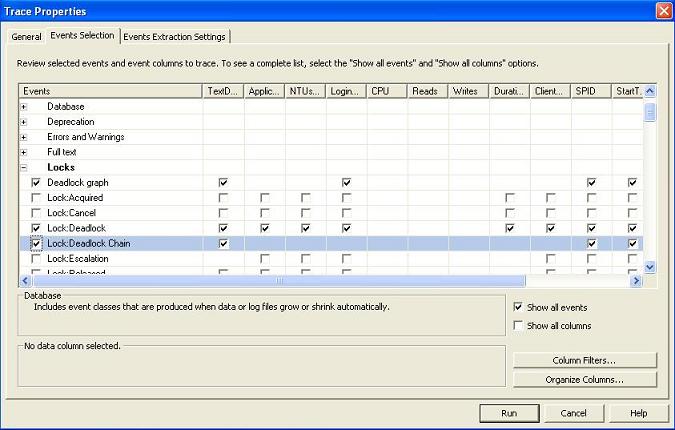
Detecting deadlocks
The SQL Profiler tool lets you do this by using the Replay trace feature. You can use a TSQL_Replay Trace template to capture events in the production server and save that trace in a .trace file. Then, you can replay the trace on the test server to re-generate and diagnose the problems.
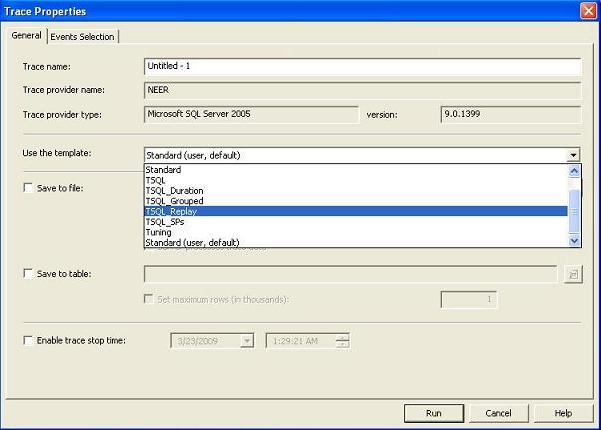
Creating Replay trace
To learn more about TSQL Replay trace, see http://msdn.microsoft.com/en-us/library/ms189604.aspx.You would like to learn and use the database tuning advisor to get tuning suggestions while you try to troubleshoot performance issues in SQL Server. Take a look at this article to learn this interesting tool:http://msdn.microsoft.com/en-us/library/ms166575.aspx.
Create Tuning profiler trace
Now, it is obvious that you just cannot run that TSQL (that is causing the performance problem) in the production server to view the actual execution plan, for lots of reasons. You can, of course, take a look at the estimated execution plan for a similar query, but this execution plan might not reflect the true execution plan that is used in reality in a fully loaded production database. SQL Profiler can help you in this regard. You can include ShowPlan, or ShowPlan XML, in your trace while profiling in the production server. Doing this would capture SQL plans along with the TSQL text while tracing. Do this in the test server too, and analyze and compare both execution plans to easily find out the difference in them.
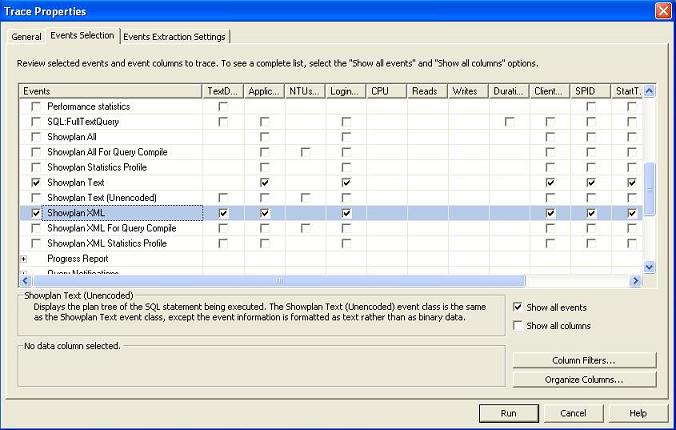
Specifying execution plans to be included in the trace

Execution plan in the profiler trace
Use the Performance Monitoring Tool (Perfmon) to diagnose performance problems
When you encounter performance related problems in your database, SQL Profiler would enable you to diagnose and find out the reasons behind the performance issues in most cases. But, sometimes the profiler alone cannot help you in identifying the exact cause of the problems.
For example, when analyzing the query execution time using the profiler in the production server, you've seen that the corresponding TSQL is executing slowly (say, 10 seconds), though the same query takes a much lower time in the test server (say, 200 ms). You analyzed the query execution plans and data volume, and found those to be roughly the same. So there must have been some other issue that was creating a bottleneck situation in the production server. How would you diagnose this problem then?
The Performance Monitoring Tool (known as Perfmon) comes to your aid in these kinds of situations. Performance Monitor is a tool (that is built-in within the Windows OS) that gathers statistical data related to hardware and software metrics from time to time.
When you issue a TSQL to execute in the database server, there are many stakeholders participating in the actions to execute the query and return the result. These include the TSQL Execution engine, Server buffer cache, SQL Optimizer, Output queue, CPU, Disk I/O, and lots of other things. So, if one of these does not perform its corresponding task well and fast, the ultimate query execution time taken by the database server would be high. Using the Performance Monitoring Tool, you can take a microscopic look at the performance of these individual components and identify the root cause of the performance problem.
With the Performance Monitoring Tool (system monitor), you can create a counter log including different built-in counters (that measures the performance of each individual component while executing the queries) and analyze the counter log with a graphical view to understand what's going on in detail. Moreover, you can combine the performance counter log with the SQL Profiler trace for a certain period of time to better understand the complete situation while executing a query.
Basic use of Performance Monitor
Windows has lots of built-in objects with their corresponding performance counters. These are installed when you install Windows. While SQL Server gets installed, performance counters for SQL Server also get installed. Hence, these counters are available when you define a performance counter log.
Follow these steps to create a performance counter log:
- Launch the Performance Monitor Tool from Tools->Performance Monitor in the SQL Profiler tool.
- Create a new performance counter log by clicking on Counter Logs->New Log Settings.
- Click on the "Add Counters" button to select the preferred counters in the newly created counter log.
- Add the preferred counters by selecting the desired objects and their corresponding counters from the list. Click on "Close" when done.
- The selected counters will be displayed in the form.
- Click on the Log Files tab and click on the "Configure" tab to specify the log file location and modify the log file name if required. Click "OK" when done.
- Click on the "Schedule" tab to specify a schedule for reading the counter information and write in the log file. Optionally, you can also select "Manually" for the "Start log" and "Stop log" options, in which case, the counter data will be logged after you start the performance counter log.
- Click on the "General" tab and specify the interval for gathering counter data.
- Press "OK" and start the performance counter log by selecting the counter log and clicking Start. When done, stop the counter log.
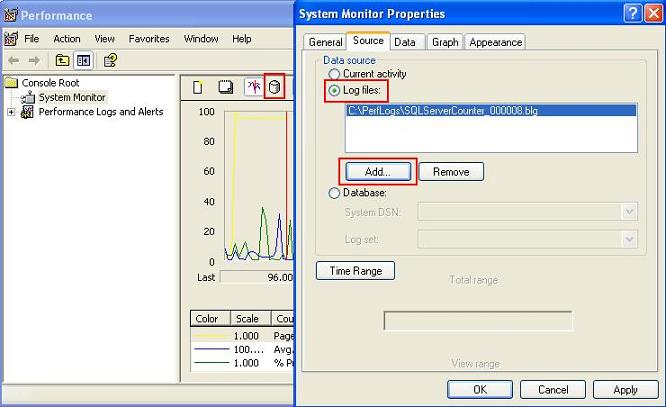
- For viewing log data, close and open the Performance Monitor Tool again. Click on the View Log icon (the icon in the red box) to view the counter log. Click on the "Source" tab and select the "Log files" radio button, and add the log file to view by clicking on the "Add" button.
- By default, only three default counters are selected to be shown in the counter log output. Specify other counters (that were included while creating the counter log) by clicking on the "Data" tab and selecting the desired counters by clicking on the "Add" button.
- Click the "OK" button to view the performance counter log output in a graphical view.

Figure : Launch Performance Monitor Tool

Create a performance counter log
Specify the log file name and press OK.
Specify the name for the performance counter log

Add counters for the performance counter log

Specify the objects and the corresponding counters

Specify the counters

Specify the performance counter log location

Scheduling the performance counter log operation

Setting the counter sample interval

Starting the performance counter logging
Viewing the performance counter log

Specifying the counters to view the data in the log

Viewing the performance counter log
Correlate the performance counter log and SQL Profiler trace for better investigation
The SQL Profiler can give you information about long running queries, but it cannot provide you with the context information to explain the reason for the long query execution time.
On the other hand, the Performance Monitor Tool gives you statistics regarding an individual component's performance (context information), but it does not give you information regarding the query execution time.
So, by combining the performance counter log with the SQL Profiler trace, you can get the complete picture while diagnosing performance problems in SQL Server.
Correlating these two things serve another important purpose also. If the same query takes longer time in the production server to execute than in the test server, that indicates the test server may not have the same amount of load, and the same environment and query execution context as the production server. So, to diagnose the performance problem, you need a way to simulate the production server's query execution context in the test server somehow. You can do this by correlating the SQL Profiler trace at the test server with the performance counter log that is taken at the production server (obviously, the SQL Profiler trace and performance counter log that are taken within the same time period alone can be correlated).
Correlating these two tool outputs can help you in identifying the exact root cause of the performance problem. For example, you might find that each time the query takes 10 seconds to execute in the production server, the CPU utilization reaches up to 100%. So, instead of trying to tune the SQL, you should investigate the reason why the CPU utilization rises up to 100%, to optimize the query performance.
Follow these steps to correlate the SQL Profiler trace with the performance counter log:
- Create a performance counter log by incorporating the following common performance counters. Specify "Manual" option for starting and stopping the counter log.
- Network Interface\Output Queue length
- Processor\%Processor Time
- SQL Server: Buffer Manager\Buffer Cache Hit Ratio
- SQL Server: Buffer Manager\Page Life Expectancy
- SQL Server: SQL Statistics\Batch Requests/sec
- SQL Server: SQL Statistics\SQL Compilations
- SQL Server: SQL Statistics\SQL Re-compilations/sec
- Using SQL Profiler, create a trace using the TSQL Duration template (for simplicity). Add "Start Time" and "End Time" columns to the trace, and start the profiler trace and the performance counter log created in the previous step at the same time.
- When enough tracing has been done, stop both the SQL Profiler trace and the performance counter log at the same time. Save the SQL Profiler trace as a .trc file in the file system.
- Close the SQL Profiler trace window and open the trace file again with the profiler (.trc file) that was saved in the previous step (yes, you have to close the profiler trace and open the trace file again; otherwise, you won't get the "Import Performance Data" option enabled; this looks like a bug in the Management Studio). Click on "File->Import Performance Data" to correlate the performance counter log with the SQL Profiler trace. (If the Import Performance Data option is disabled, something is wrong, and review your steps from the beginning.) A file browser window will appear, and select the performance counter log file in the file system that is to be correlated.
- A window will appear to select the counters to correlate. Select all counters, and press "OK". You will be presented with a screen like below that is the correlated output of the SQL Profiler trace and the performance counter log.
- Click on a particular TSQL in the profiler trace output (in the upper part of the window). You'll see that a red vertical bar will be set in the performance counter log output to indicate the particular counter statistics when that particular query was being executed. Similarly, click on the performance counter log output any where you see a certain performance counter's value is high (or, above the normal value). You'll see that the corresponding TSQL that was being executed on the database server will be highlighted in the SQL Profiler trace output.

Correlated output of SQL Profiler and Performance Monitor Tool
I bet you'll surely find correlating these two tool outputs extremely interesting and handy.
A SQL Server database has the following three kinds of files:

If you want your user objects (Tables/Views/Stored Procedures/Functions, and others) to be created in a secondary data file, then:
Please note that, Transaction log files are not included in any file group.

When you have a large (in fact, very large, possibly having millions of rows) table in your database and when you see that querying on this table is executing slowly, you should consider portioning the table (of course, after making sure that all other optimization steps are done) to improve performance.
The two following options are available to partition a table:
As you can see, we are partitioning the table by grouping the rows based upon a criteria (ID range), which seems like we have a stack of books in a box from where we are horizontally splitting the stack by taking a group of books from the top and putting it in smaller boxes. Hence this is called horizontal partitioning.
As the table size is huge (in terms of number of columns and rows), any data retrieval query from the table performs slowly. So, this table could be portioned based on the frequency of access of the columns. That is, we can split the table into two or more tables (partitions) where each table would contain a few columns from the original tables. In our case, a partition of this table should contain the columns that are frequently accessed by queries, and another partition of this table should contain the columns that are less frequently accessed by other queries. Splitting the columns vertically and putting them in different thinner partitions is called vertical partitioning.
Another good way for applying vertical partitioning could be to partition the indexed columns and non-indexed columns into separate tables. Also, vertical partitioning could be done by splitting
Like horizontal partitioning, vertical partitioning also allows to improve query performance (because queries now have to scan less data pages internally, as the other column values from the rows have been moved to another table), but this type of partitioning is to be done carefully, because if there is any query that involves columns from both partitions, then the query processing engine would require joining two partitions of the tables to retrieve data, which in turn would degrade performance.
In this article, we would focus on horizontal partitioning only.
Using the SQL command above, create three other file groups '2000', '2001', and '2002'. As you can perhaps imagine already, each of these file groups would store a year's Order data inside their corresponding data files.
Create a partition function
A partition function is an object that defines the boundary points for partitioning data. The following command creates a partition function:
Create a partition schema
The partition scheme maps the partitions of a partitioned table/index to the file groups that will be used to store the partitions.
The following command creates a partition schema:
Apply partitioning on the table
At this point, we have defined the necessary partitioning criteria. So all we need to do now is to partition the table.
In order to do this, follow these steps:
Drop the existing clustered index from the table that is most likely created due to the primary key creation on the table. The clustered index can be dropped by using the
To help you in this regard, I have developed some TSQL templates that you can use to develop DBMS objects using a consistent structure, within a short amount of time.
I've also imagined that there will be a person reviewing DBMS objects and routines created by the team. The review process helps in identifying issues that generally are missed by developers (say, best practices) due to work pressure or other issues, and the templates have a "REVIEW" section where the reviewer can put review information along with comments.
I've attached some sample templates of various DBMS objects in SQL Server. These are:
I can promise that you can now create DBMS objects using templates in an easier manner, within a quick amount of time.
Step 9: Organize file groups and files in the database
When a SQL Server database is created, the database server internally creates a number of files in the file system. Every database related object that gets created later in the database is actually stored inside these files.A SQL Server database has the following three kinds of files:
- .mdf file: This is the primary data file. There can be only one primary data file for each database. All system objects reside in the primary data file, and if a secondary data file is not created, all user objects (user created database objects) also take their place in the primary data file.
- .ndf file: These are the secondary data files, which are optional. These files also contain user created objects.
- .ldf file: These are the Transaction log files. These files could be one or many in number. They contain Transaction logs.
File group
Database files are logically grouped for better performance and improved administration on large databases. When a new SQL Server database is created, the primary file group is created and the primary data file is included in the primary file group. Also, the primary group is marked as the default group. As a result, every newly created user object is automatically placed inside the primary file group (more specifically, inside the files in the primary file group).If you want your user objects (Tables/Views/Stored Procedures/Functions, and others) to be created in a secondary data file, then:
- Create a new file group and mark that file group as Default.
- Create a new data file (.ndf file) and set the file group of this data file to the new file group that you just created.
Please note that, Transaction log files are not included in any file group.
File/ File group organization best practices
When you have a small or moderate sized database, then the default file/ file group organization that gets created while creating the database may be enough for you. But, when your database has a tendency to grow larger (say, over 1000 MB) in size, you can (and should) do a little tweaking in the file/file group organizations in the database to enhance database performance. Here are some of the best practices you can follow:- The primary file group must be totally separate, and should be left to have only system objects, and no user defined object should be created on the primary file group. Also, the primary file group should not be set as the default file group. Separating the system objects from other user objects will increase performance and enhance the ability to access tables in cases of serious data failures.
- If there are N physical disk drives available in the system, then try to create N files per file group and put each one in a separate disk. This will allow distributing disk I/O load over multiple disks, and will increase performance.
- For frequently accessed tables containing indexes, put the tables and the indexes in separate file groups. This would enable reading the index and table data faster.
- For frequently accessed table containing
TextorImagecolumns, create a separate file group and put the text, next, and image columns in that file group on different physical disks, and put the tables in a different file group. This would enable faster data retrieval from the table with queries that don't contain text or image columns. - Put the transaction log file on a different physical disk that is not used by the data files. The logging operation (Transaction log writing operation) is more write-intensive, and hence it is important to have the log on the disk that has good I/O performance.
- Consider assigning "Read only" tables into a file group that is marked as "Read only". This would enable faster data retrieval from these read only tables. Similarly, assign "Write only" tables in a different file group to allow for faster updates.
- Do not let SQL Server fire the "Auto grow" feature too often because it is a costly operation. Set an "Auto grow" increment value so that the database size is increased less frequently (say, once per week). Similarly, do not use the "Auto shrink" feature for the same reason. Disable it, and either shrink the database size manually, or use a scheduled operation that runs in a timed interval (say, once a month).
Step 10: Apply partitioning in big fat tables
What is table partitioning?
Table partitioning means nothing but splitting a large table into multiple smaller tables so that queries have to scan less amount of data while retrieving. That is "Divide and Conquer".When you have a large (in fact, very large, possibly having millions of rows) table in your database and when you see that querying on this table is executing slowly, you should consider portioning the table (of course, after making sure that all other optimization steps are done) to improve performance.
The two following options are available to partition a table:
Horizontal partitioning
Suppose we have a table containing 10 million rows. For easy understandability, let's assume that the table has an auto-increment primary key field (say, ID). We can divide the table's data into 10 separate portioning tables where each partition will contain 1 million rows and the partition will be based upon the value of the ID field. That is, the first partition will contain those rows which have a primary key value in the range 1-1000000, and the second partition will contain those rows which have a primary key value in the range 1000001-2000000, and so on.As you can see, we are partitioning the table by grouping the rows based upon a criteria (ID range), which seems like we have a stack of books in a box from where we are horizontally splitting the stack by taking a group of books from the top and putting it in smaller boxes. Hence this is called horizontal partitioning.
Vertical partitioning
Suppose we have a table with many columns and also millions of rows. Some of the columns in the table are very frequently accessed in some queries, and most of the columns in the table are less frequently accessed in some other queries.As the table size is huge (in terms of number of columns and rows), any data retrieval query from the table performs slowly. So, this table could be portioned based on the frequency of access of the columns. That is, we can split the table into two or more tables (partitions) where each table would contain a few columns from the original tables. In our case, a partition of this table should contain the columns that are frequently accessed by queries, and another partition of this table should contain the columns that are less frequently accessed by other queries. Splitting the columns vertically and putting them in different thinner partitions is called vertical partitioning.
Another good way for applying vertical partitioning could be to partition the indexed columns and non-indexed columns into separate tables. Also, vertical partitioning could be done by splitting
LOB or VARCHARMAX columns into separate tables.Like horizontal partitioning, vertical partitioning also allows to improve query performance (because queries now have to scan less data pages internally, as the other column values from the rows have been moved to another table), but this type of partitioning is to be done carefully, because if there is any query that involves columns from both partitions, then the query processing engine would require joining two partitions of the tables to retrieve data, which in turn would degrade performance.
In this article, we would focus on horizontal partitioning only.
Partitioning best practices
- Consider partitioning big fat tables into different file groups where each file inside the file group is spread into separate physical disks (so that the table spans across different files in different physical disks). This would enable the database engine to read/write data operations faster.
- For history data, consider partitioning based on "Age". For example, suppose a table has order data. To partition this table, use the Order date column to split the table so that a partition is created to contain each year's sales data.
How to partition?
Suppose, we have an Order table in our database that contains Order data for 4 years (1999, 2000, 2001, and 2002) and this table contains millions of rows. We would like to apply partitioning on this table. To do that, the following tasks are to be performed:- Add user defined file groups to the database Use the following SQL command to create a file group:
ALTER DATABASE OrderDB ADD FILEGROUP [1999]

ALTER DATABASE OrderDB ADD FILE (NAME = N'1999', FILENAME
= N'C:\OrderDB\1999.ndf', SIZE = 5MB, MAXSIZE = 100MB, FILEGROWTH = 5MB) TO
FILEGROUP [1999]
Here, we are adding a file group '1999' and adding a secondary data file 'C:\OrderDB\1999.ndf' to this file group. We did this because we would like to put our table partitions into separate files in separate file groups.Using the SQL command above, create three other file groups '2000', '2001', and '2002'. As you can perhaps imagine already, each of these file groups would store a year's Order data inside their corresponding data files.
CREATE PARTITION FUNCTION FNOrderDateRange (DateTime) AS
RANGE LEFT FOR VALUES ('19991231', '20001231', '20011231')
The above partition function specifies that the Order date column has a value between:DateTime <= 1999/12/31 would fall into 1<sup>st</sup> partition.
DateTime > 1999/12/31 and <= 2000/12/31 would fall info 2<sup>nd</sup> partition.
DateTime > 2000/12/31 and <= 2001/12/31 would fall info 3rd partition.
DateTime > 2001/12/31 would fall info 4th partition.
RANGE LEFT is used to specify that the boundary value should fall into the left partition. For example, here the boundary value 1999/12/31 is falling into the first partition (with all other dates less than this value), and the next value is falling into the next partition. If we specify RANGE RIGHT, then the boundary value would fall into the right partition. So, in this example, the boundary value 2000/12/31 would fall into the second partition, and any date less than this value would fall into the first partition.The following command creates a partition schema:
CREATE PARTITION SCHEME OrderDatePScheme AS PARTITION FNOrderDateRange
TO ([1999], [2000], [2001], [2002])
Here, we are specifying that:The 1<sup>st</sup> partition should go into the ‘1999' file group
The 2<sup>nd </sup>partition should go into the ‘2000' file group
The 3<sup>rd</sup> partition should go into the ‘2001' file group
The 4<sup>th</sup> partition should go into the ‘2002' file group
In order to do this, follow these steps:
Drop the existing clustered index from the table that is most likely created due to the primary key creation on the table. The clustered index can be dropped by using the
DROP INDEX statement. Assuming that PK_Orders is the primary key of the table, use the following command to drop the Primary Key, which will eventually drop the clustered index from the table:ALTER TABLE Orders DROP CONSTRAINT
PK_Orders
Recreate the clustered index on the partition scheme. The index can be created on a partitioned scheme as follows:CREATE UNIQUE CLUSTERED INDEX PK_Orders ON Orders(OrderDate) ON
OrderDatePScheme (OrderDate)
Assuming that the OrderDate column values are unique in the table, the table will be partitioned based on the partition scheme specified (OrderDatePScheme), which internally uses the partition function to partition the table into 4 smaller parts in 4 different file groups.
There are quite a few very well-written articles on the web on Table partitioning. I can mention a few here:- Partitioned Tables and Indexes in SQL Server 2005 (A very detailed explanation on partitioning).
- SQL Server 2005 Database Table Partitioning Tutorial - How to Horizontal Partition a Database Table (A very simple and easily understandable tutorial on partitioning).
Step 11 (The bonus step): Better-manage DBMS objects, Use TSQL templates
We all know that in order to better manage DBMS objects (Stored Procedures, Views, Triggers, Functions, etc.), it's important to follow a consistent structure while creating these. But, for many reasons (time constraints mainly), most of the time, we fail to maintain a consistent structure while developing these DBMS objects. So when code is debugged later for any performance related issue or a reported bug, it becomes a nightmare for any person to understand the code and find the possible causes.To help you in this regard, I have developed some TSQL templates that you can use to develop DBMS objects using a consistent structure, within a short amount of time.
I've also imagined that there will be a person reviewing DBMS objects and routines created by the team. The review process helps in identifying issues that generally are missed by developers (say, best practices) due to work pressure or other issues, and the templates have a "REVIEW" section where the reviewer can put review information along with comments.
I've attached some sample templates of various DBMS objects in SQL Server. These are:
- Template_StoredProcedure.txt: Template for developing Stored Procedures
- Template_View.txt: Template for developing Views
- Template_Trigger.txt: Template for developing Triggers
- Template_ScalarFunction.txt: Template for developing Scalar functions
- Template_TableValuedFunction.txt: Template for developing Table valued functions
How to create templates
At first, you need to create templates in your SQL Server Management Studio. To do this, you need to download the attached templates and follow the steps given below. I've used Template_StoredProcedure.txt for creating the Stored Procedure template. You can follow the same procedure to create the other templates.- Open SQL Server Management Studio and go to View->Template Explorer.
- Go to Template Explorer, "Stored Procedure" node, and expand it:
- Rename the newly created blank template as follows:
- Right click on the newly created template and open it in Edit mode, as follows:
- SQL Server Management Studio will ask for credentials. Provide valid credentials, and press "Connect" to access the database instance and to edit the template.
- Open the attached Template_StoredProcedure.txt in an editor, copy all the contents, and paste onto the template that is being edited in Management Studio:
- Save the template by pressing the Save button in Management Studio:


How to use the templates
Well, after creating all the templates in SQL Server Management Studio, it's time to use them. I am showing how to use the Stored Procedure template here, but the procedure is the same for all the other templates- In Template Explorer, double click on the newly created Stored Procedure template:
- SQL Server Management Studio will ask for valid credentials to use the template. Provide valid credentials and press "Connect".
- After connecting successfully, the template will be opened in the editor for filling up the variables with appropriate values:
- Specify the values for the template by clicking the following icon. Alternatively, you can press Ctrl+Shift+M to do the same.
- Specify the parameter values and press "OK".
- The template will be filled up with the provided values.
- Select the target database where you would like to execute the Stored Procedure creation script, and press the Execute icon:
- If everything is OK, the Stored procedure should be created successfully.


I can promise that you can now create DBMS objects using templates in an easier manner, within a quick amount of time.


Comments
Post a Comment